

Air Pollution
Written by Pete Knapp, air quality researcher at Imperial College London
Contact: p.knapp19@imperial.ac.uk
Do you know anyone who has an allergy or asthma? Or anyone who had a stroke, suffering dementia, or died from heart disease? Air pollution is likely to have been a contributor.
92% of the world population lives with polluted air that fail to meet the World Health Organisation (WHO) levels of air quality guidelines. There are two main types of air pollutants: (i) gases that irritate your lung lining, like ozone, ammonia, nitrogen and sulphur oxides (called NOx and SOx); and (ii) particulate matter (PM) like smoke particles and sand from sandstorms. Sometimes gases become PM by reacting with sunlight and other gases, and these are called ‘secondary PM’. If PM comes directly from a source, like a fire, then it’s called ‘primary PM’.
Some PM is more toxic because of its:
shape (like sharp fibres in asbestos particles that can lead to asbestosis);
size (generally the smaller it is, the more toxic it is);
surface charge (how positively or negatively charged it is);
and what it’s made of (PM from coal, for example, is more toxic than PM from soil dust).
Particles could be made of many different things, such as soot, sea salt, microplastics, metals, or ammonium compounds. The most toxic particles are from diesel engines, followed by petrol engines, wood-fire smoke, coal smoke, and road dust. This means people living near busy roads are likley to breathe the most toxic air. There is still a lot more research on the effect of composition on toxicity that is needed.
There are around 650,000 deaths in the UK per year, and between 26,000 and 38,000 deaths are attributed to air pollution. This is around 5% of deaths, although air pollution is known to make people more likely to die from COVID-19, so this figure may be an underestimate.
Globally, however, air pollution from fossil fuel combustion cause at least 1 in 5 of all deaths. That’s 8.7 million people, the number of people living in London, every year. Or, to put it another way, air pollution from fossil fuels is not only a main driver of the climate crisis but it also kills 3 times more people each year than HIV (0.69m in 2019), tuberculosis (1.4m in 2019), and malaria (0.41m in 2019) combined.
PM 2.5
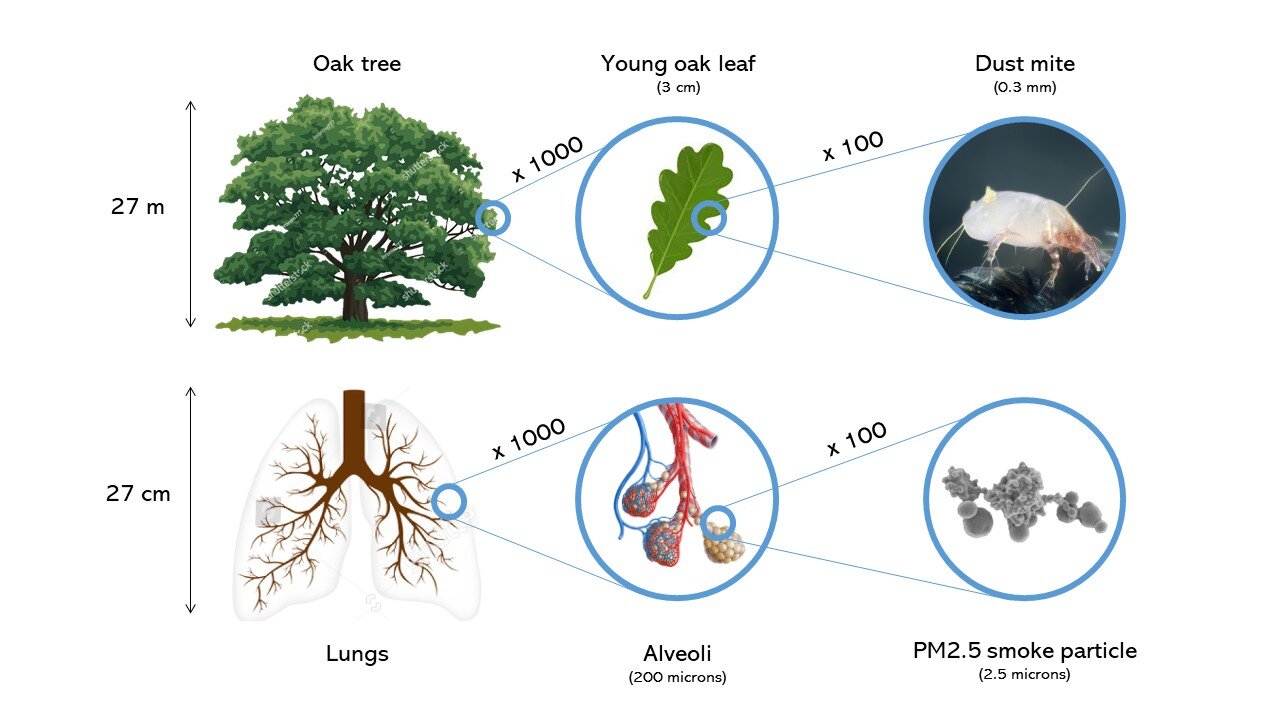
If a particle is smaller than 2.5 microns, then they can reach deep into the lungs. We call this PM2.5 and it generally comes from burning things or when gases react with sunlight. Smaller particles, which are 0.1 microns or smaller, can pass into the blood stream, and have been found in every organ in the body. This is called PM0.1, but it’s not commonly used because it’s difficult to measure.
How big is PM2.5? Imagine one of your lungs is the size of an average oak tree. The alveoli – the sacs at the ends where air mixes with blood – would be about 2cm wide, the size of a fresh spring leaf. PM2.5 would be anything that is the size of a dust mite or smaller. The coronavirus would be 10 times smaller than that. When particles are this small, they cause inflamation. If this happens all the time (called ‘chronic exposure’), then the body reacts badly causing diseases such as:
strokes, dementia, Alzheimer’s and Parkinson’s disease, which are the leading causes of deaths in the UK;
heart disease;
lung cancer, COPD, and asthma;
and diabetes.
We usually measure PM2.5 by how many micrograms of it float around in a cubic metre of air. A microgram is a millionth of a gram, and it is given the symbol μg. The standard measurement of air pollution is therefore μg/m3 (to be read as ‘2.5 micrograms per metre cubed’). The WHO guideline for how much PM2.5 people should be exposed to is 5μg/m3 as an average over a year. The WHO guideline for exposure in one day is 15μg/m3.
This standard measurement is not very good on its own. It doesn't tell us how many particles there are in this volume, just the mass. For example: 1kg of apples and 1kg of sand have the same mass, but if you tip them on the floor then the effect is very different. Apples are easily picked up, in the same way that your immune system can more easily deal with pollen, but sand scatters everywhere, much like diesel exhaust and wood smoke coat your lungs and pervade your bloodstream. Ultrafine particles (under 0.1 microns, called PM0.1) weigh very little, and are possibly more dangerous than PM2.5. The number of particles in a cubic metre is rarely measured by councils but it is a very important figure.

The distance between you and the pollution source matters quite a lot, as some larger particles in the air settle to the ground and some stick to surfaces. The terms ‘settling’ and ‘deposition’ are used to describe these effects. The electrical charge can make aerosols stick to surfaces more easily, but we don’t know much about which air pollutants have electrical charge (my PhD research is on charge distributions of indoor aerosols). Air pollutants also disperse in the air like warmth from a fire reduces with distance, so being further away from a fire will mean you’ll be less exposed to its pollution. In the real world, we can use these concepts to reduce our exposure to air pollution, such as taking routes that avoid busy roads, ventilating rooms, and how long we spend in polluted areas.
COVID-19
It is partly exposure to air pollution that has made people more susceptible to dying from Covid-19. Experimental studies have shown that exposure to air pollution leads to a decreased immune response, thereby making it easier for viruses to get into our systems and wreak havoc. Nasal cells exposed to ozone made them easier for flu viruses to get into them. Lung cells exposed to ‘secondary organic aerosols’ from traffic or wood fires led to increased flu virus replication and exposure to ultrafine particles (like those from diesel exhaust) inflame lung cells. Mice exposed to high NO2 (mostly from traffic) for 2 days needed 100 times less virus to be infected than those who weren’t. A study involving 222 children showed those living close to an electronic waste area with high PM2.5 concentrations had significantly less protective saliva against viruses. Air pollution may have increased Covid-19 deaths by 19% in Europe and 27% in East Asia.
outdoor air pollution
There are many sources of outdoor air pollution, such as from human sources: industry, land traffic, domestic heating & cooking, biomass burning (like the annual ‘Southeast Asian Haze’ from slash-and-burn), power generation, agriculture; and natural sources (like sand storms). These different sources are dominant in different parts of the world, and therefore the leading cause of death from air pollution changes dependent on the location.
Outdoor air pollution, mostly PM2.5, kills 3.3 million people every year worldwide, predominantly in Asia. The largest cause of death from outdoor air pollution is from residential energy use such as heating and cooking, prevalent in India and China, accounting for around 1 million deaths a year from billowing outside homes and shrouding cities in smoke. Focusing indoors, an additional 3.54 million deaths per year are due to indoor air pollution from essentially the same source. It is worth noting that these figures do not take into account the composition of the PM2.5, where fossil-fuel pollutants may be five times more toxic than agricultural pollutants if composition were to be taken into account.

Rates and leading causes of death from outdoor air pollution in 2010, from here.
The focus will be mainly on the UK throughout this page, but this is because I anticipate the largest audience will be from the UK. Air pollution affects everyone around the world and has strong links with both climate change and biodiversity loss. By going into the details of air pollution in the west, I hope that a going awareness will help to address the global issues around air pollution that may be predominantly from different causes.
agriculture
Ammonia is a chemical that comes predominantly from agriculture, and when it mixes with NOx (mostly from traffic), SOx (mostly from coal) and VOCs (mostly from industry, personal products and fossil fuel extraction) it produces PM2.5. This kind of PM2.5 then contains sulphur and nitrogen, becoming an important contributor to acidification (that causes acid rain and runs off into waterways and oceans) and eutrophication (providing so much nitrogen that algae blooms and starves all other water life of oxygen). Halving agricultural emissions could prevent 250 000 deaths per year worldwide. From rising sea temperatures, algal blooms will be more likely with climate change. A total of 47% of ammonia comes from cattle alone, and 17% from fertilisers and due to this imbalance 80% of ammonia emissions in Europe are from just 5% of farms, mainly from animal-rearing farms.
As shown in the graphic from ‘Outdoor Air Pollution’, the dominant source of air pollution deaths in Europe is agriculture and accounts for around a fifth of global air pollution deaths. However, once composition is taken into account (with the assumption that fossil-fuel sources are five times greater in toxicity than agricultural sources) then the dominant source in Europe is from traffic. Ammonia exists as either a gas or a liquid, and affects the environment in different ways: gas ammonia is more damaging to moorland and bog plant communities; and liquid ammonia reduces species richness in UK vegetation. Air pollution from agriculture is carried for thousands of miles, and it is estimated that agriculture and shipping contribute to 43% of total sulphur deposition and 46% of nitrogen deposition in the UK, although this of course goes the other way too, where UK agriculture and shipping deposit onto mainland Europe.

Birmingham’s air was more polluted when agricultural compounds (in yellow) were more abundant. This shows the effect that agriculture has on air pollution in cities.
Nitrogen from fertilisers reacts with the soil to form NOx, and this process is estimated to account for 20-32% of NOx emissions in California, which supports 12.2% of the USA food economy. By controlling ammonia emissions from agriculture and fertiliser use, especially in North America and Europe, PM2.5 concentrations can be significantly reduced, as well as reducing sulphur and nitrogen oxides emissions to reduce acid rain and air pollution harmful to human, fauna and flora health.
Birmingham’s air was more polluted when agricultural compounds (in yellow) were more abundant. This shows the effect that agriculture has on air pollution in cities.
shipping and cruises
Most things that we buy, from clothes to electronics, are made in other countries and shipping is therefore a huge industry required to support our lifestyles. Poor air quality due to international shipping accounts for approximately 400,000 premature deaths per year worldwide. This is from the sulphur, nitrogen and black carbon from burning fuel. Shipping remains the least regulated transport sector regarding air pollution. In 2005, in the seas surrounding Europe, sulphur dioxide (SO2) emissions from international shipping were estimated at 1.7 million tonnes a year (over 10 times the SO2 from all UK fossil fuel combustion), NOx emissions at 2.8 million tonnes (over 3 times the NOx from all UK transport), and particulate matter (PM2.5) at 195,000 tonnes (twice the UK emissions). The SO2 and NOx are both major drivers for acid rain and particulate pollution, and although low-sulphur fuels are encouraged, these marine fuels will still account for ~250,000 deaths and ~6.4 million childhood asthma cases annually.

“Argentina–> Thailand –> USA. These pears took two trips across the Pacific ocean before I ate them” from Reddit, 2020
Shipping consumed about 3.8m barrels of fuel oil a day in 2017, which is 4% of global fuel oil usage. Carbon from shipping makes up about 3% of global total carbon emissions (more than the total domestic UK emissions), but is expected to rise to 17% by mid-century. For historic reasons, shipping has been excluded from calculations of international greenhouse gas emissions, and thus exempted from governments’ obligations under UN climate agreements. This means shipping was excluded the landmark Paris accord of 2015. An encouraging result from the May 2021 G7 summit was that the UK “will be seeking to increase ambition to ensure that international shipping plays its part in delivering decarbonisation” and the International Maritime Organisation aimed to halve their global greenhouse gas emissions by 2050 compared with 2008 figures. With decarbonisation, a decrease in NOx, SO2 and PM2.5 is expected. But things aren’t that simple: SO2 also provides a cooling effect by reflecting the Sun’s rays back into space, and using low-sulphur fuels could equate to a 3% increase of man-made heating.

Cruises use heavy fuel oil, the dirtiest of all heavy oils. European luxury cruises produce ten times more SOx than all European diesel cars. Cruises in both Norway and Croatia emitted more NOx than these countries’ entire diesel traffic in a year. To restate, SOx and NOx cause premature death, including from lung cancer and cardiovascular disease, and morbidity like childhood asthma. They also contribute to acidification in terrestrial and aquatic environments. NOx contribute to particle and ozone formation, in addition to causing acidification and eutrophication upon deposition on land, lakes and seas. Cruises in Europe are nearly entirely around coastlines, which pollutes the air on land, too.
Beyond air pollution, 100 million gallons of petroleum products and 1 billion gallons of untreated sewage leak into the oceans from cruise ships every year. Taking a cruise would produce around twice more CO2 emissions per mile than flying.

wood burning
We rightfully campaign for clean air zones and low traffic neighbourhoods, to abandon the Silvertown tunnel and the building of incinerators in built-up areas as we value clean air. Yet many seem totally unaware of the largest source of PM2.5 pollution in the UK. Only 8% of the UK homes burn wood, but this accounts for around 40% of the total PM2.5 emissions, over three times the level generated by traffic. This is a growing issue in the UK, where wood-burning contributed 87% of domestic combustion emissions in 2018, compared with 13% in 1990, as wood essentially replaced domestic coal burning. People are unlikely to buy a new fireplace when they have a traditional-looking 100-year-old one in their home, and this is shown to be the case as 68% of wood-burning in London homes is using an open fireplace, which is the least efficient way to burn wood. A UK survey from 2016 showed wood-burning produces 2.6 times more particle emissions than traffic exhaust.

PM2.5 origins, but note that some PM2.5 is produced from a mixture of sources, such as NOx from traffic mixing with ammonia from agriculture (The Economist 2018)
Home-style magazines and renovation programmes often show beautifully decorated homes with a wood fire. Country Living wrote “the Government has announced plans to phase out the sale of coal and wet wood in England between 2021 and 2023. This means that suppliers will need to offer cleaner, more eco-friendly burning materials – such as dry wood”. Notice the language here – ‘cleaner’ and ‘eco-friendly’. Although it may be true that washing yourself in horse manure is cleaner than washing in a bath of crude oil, neither are clean.
Wood burners triple the level of harmful pollution particles inside homes and should be sold with a health warning. In January 2021, experts at Asthma UK and the British Lung Foundation asked people to use wood burners only if they had no alternative source of heat. Over 1 million wood stoves were bought between 2010 and 2015 and, to justify the investment, wood is often burnt every day. This wood smoke drifts into neighbours’ houses so lots of people are exposed. The South East is the second richest region of the UK and has seen double the increase in wood burning stoves than any other region since 2003, highlighting that this problem is created more by a lifestyle choice.
Wood burning ‘feels’ environmentally friendly. Rather than burning fossil fuels, wood feels like a renewable source, which sucks up carbon from the atmosphere and provides homes for birds and insects along the way. Unfortunately, this wood is from either rich woodlands or monocultures that have poor biodiversity. Due to increased demand, the UK is the third largest importer of firewood in the world, and this increases chances of plant diseases and insects that can be inadvertently brought along with the firewood, which can cause serious problems for UK woodlands. Latvia exports a significant proportion of firewood to the UK, and they have observed sharp declines in forest birds as felling increased.
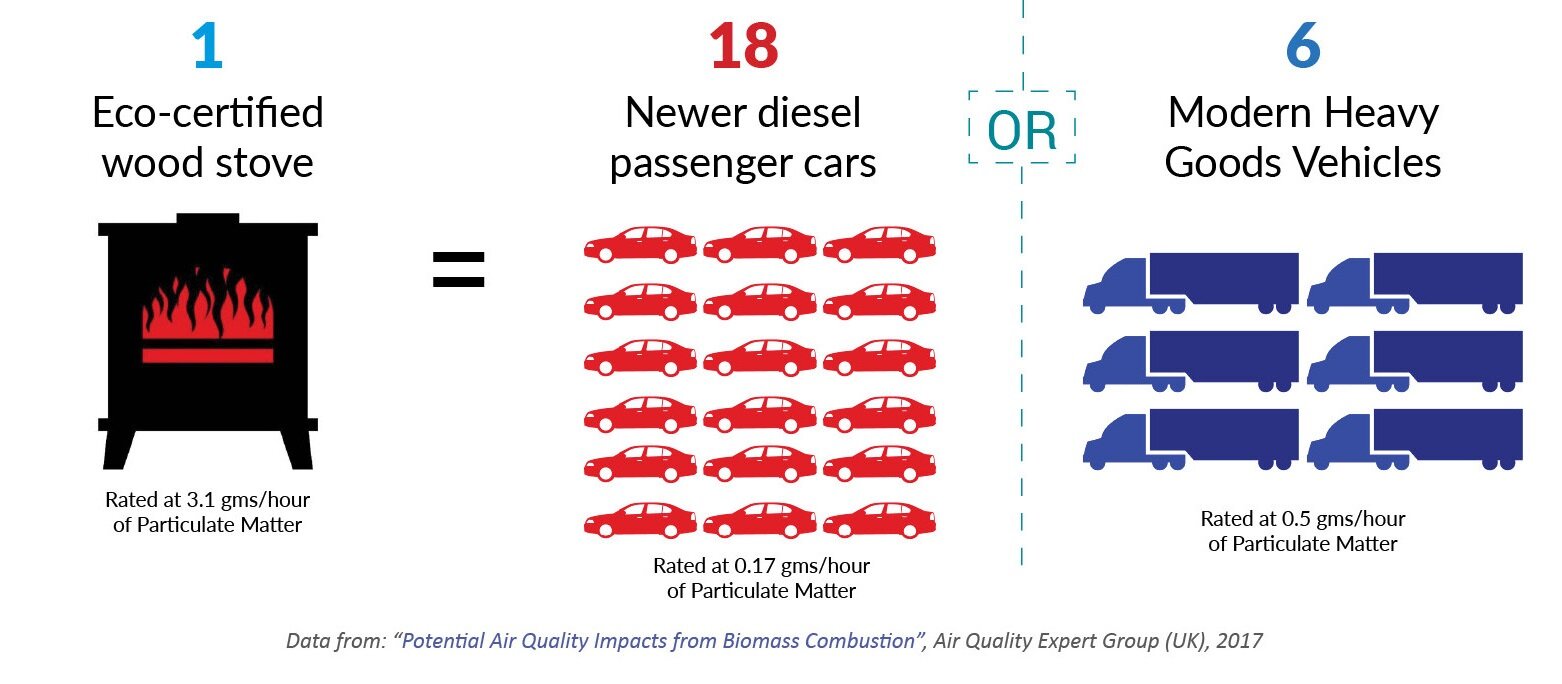
Modern stoves produce a quarter of the emissions of an open fire, with air coming in at specific points to ensure highest rates of wood combustion. Stoves sold in Europe will, by 2022, must meet Ecodesign standards that set limits on how much smoke a stove can produce. This limit is still higher than 18 modern diesel cars. Additionally, as with the diesel scandal (see the later section), there is a big difference between test performance and real-world emissions. A 2015 study showed that the amount of smoke produced by a wood stove can produce 16 times over the approval limits, with the biggest factor being the way that the person lit the fire.
In a world where forests are being cut down at a rate of one football field every two seconds, chopping down trees for wood burners is one of the last things Europeans want to be doing. Instead, we in the UK need to be serious about replacing wood burners with heat pumps and requiring government subsidy to help this transition. A government scheme in Tasmania in 2001 provided people with A$500 to switch to electric heating and the number of wood-burning homes dropped from 66% to 30%, seeing winter death rates fall by 11%.
Think about a wood-burning stove as an enormous exhaust pipe on top of your house. Image from here.

Government incentives encourage people to burn wood as a ‘renewable heating system’, or a ‘biomass boiler’ under the ‘Domestic Renewable Heat Incentive’.
indoor air pollution
In the UK, we spend around 90% of our time indoors and, in the era of pandemics, this is likely to increase, so let’s talk about indoor air.
In our efforts to improve the energy efficiency of buildings, we have less draughty windows and we try to keep warmth trapped in our homes. This also traps pollution, such as smoke from cooking, smoulder from incense, dust from carpets, fumes from cleaning, and flushing from toilets.
Since I started to measure the air quality with a PM2.5 sensor (a Kaiterra Laser Egg +CO2), I have become much more aware that the air indoors is often much worse than outdoors, especially when frying or using a toaster. I strongly recommend either buying or making an air quality sensor to see how cooking, hair straighteners, wood stoves or incense might affect the enclosed air you’re breathing. As cheap sensors (under £150) can be wildly inaccurate for low concentrations and can change a lot with humidity, they are useful only to see what makes the numbers go up or down, rather than the actual value it’s reading. More expensive ones (between £150-£300) are more likely to give you an accurate figure, such as the TSI BlueSky or Purple Air 2.
Indoor rooms are hotboxes of pollution, with many aerosols being generated from cooking, cleaning, carpets, smoking, incense and scented candles, air fresheners, deodorants, hairsprays, and so on. Personally, I became much more likely to think about this to reduce exposure to indoor air pollution once I had a sensor. If you want to know what the outdoor air pollution level is, find your nearest (UK) station here. If your nearest sensor is miles away, request one from your local council. There is also a network of amateur monitoring worldwide (mostly Europe) here.
Incense burning creates around 4.5 times more particulate matter than a cigarette, and more 100 times the number of fine particles than a candle, so they should be avoided indoors.

Incense and candles, used are two of the most polluting activities indoors. Many religious ceremonies burn things indoors, and this should be challenged.
Cooking is one of the worst offenders for indoor air pollution, where grilling and frying could be equivalent to having 10 cars idling in a western kitchen. For frying at high temperatures, high-temperature sunflower oil has the lowest emissions and olive oil has the highest emissions. All emissions are significantly reduced by opening windows during cooking, and by frying at lower temperatures and foods with less fat. Cooking with induction hobs or heating elements rather than gas helps to reduce indoor air pollution as well as helping to move away from fossil fuels.

Different oils produce pollution at hotter temperatures. From here.
Gas stoves produce harmful particulate pollution, spiking emissions of nitrogen dioxide and carbon monoxide to levels that would violate outdoor pollutant standards. Gas stoves even leak methane into the home when they are turned off. (Tip: change your gas stove for an electric one, or use a portable hot plate, costing under £100). However, the cooking fuels that almost 3 billion people from low- and middle-income countries rely upon are wood, straw, dung and other biomass, and in low-income countries this household pollution is the second greatest risk factor for early death. The women, children and elderly are often exposed to this pollution source the most, resulting in pneumonia that is not seen in high-income countries. 3.8 million people every year die prematurely from illness attributable to the household air pollution caused by the inefficient use of solid fuels and kerosene for cooking. The WHO leads the way here by providing technical support to countries in their own evaluations and scale-up of health-promoting household fuels and technologies.
Polyaromatic hydrocarbons (PAHs) are chemicals that are produced from burning. This includes from the oil and gas in cooking, incense, cigarettes, wood fires, etc. Over long periods of exposure to PAHs, health effects include cataracts, kidney and liver damage, and jaundice.
There are many reasons to fight against fast food restaurants, but the air pollution that they generate hardly gets a mention. Particle numbers from grilling and frying meat extend to a range of around 200 metres, and inside the restaurants this is much higher. As a cleaner alternative to deep-fat fryer, 'air frying' a sausage can still increase the PM2.5 particle number by over 1500 times the normal level.
The main takeaway from this is to open windows as much as you can, and to campaign for cleaner air outside so that you can do this freely. Air quality monitors are very helpful but only if you have an air purifier too. You don’t need to spend a lot of money on purifiers, however much the companies selling them might make you think that you should. Here is a good starting point for making your own air purifier, and your own monitor (using pretty decent sensors).
Asthma (and allergies)
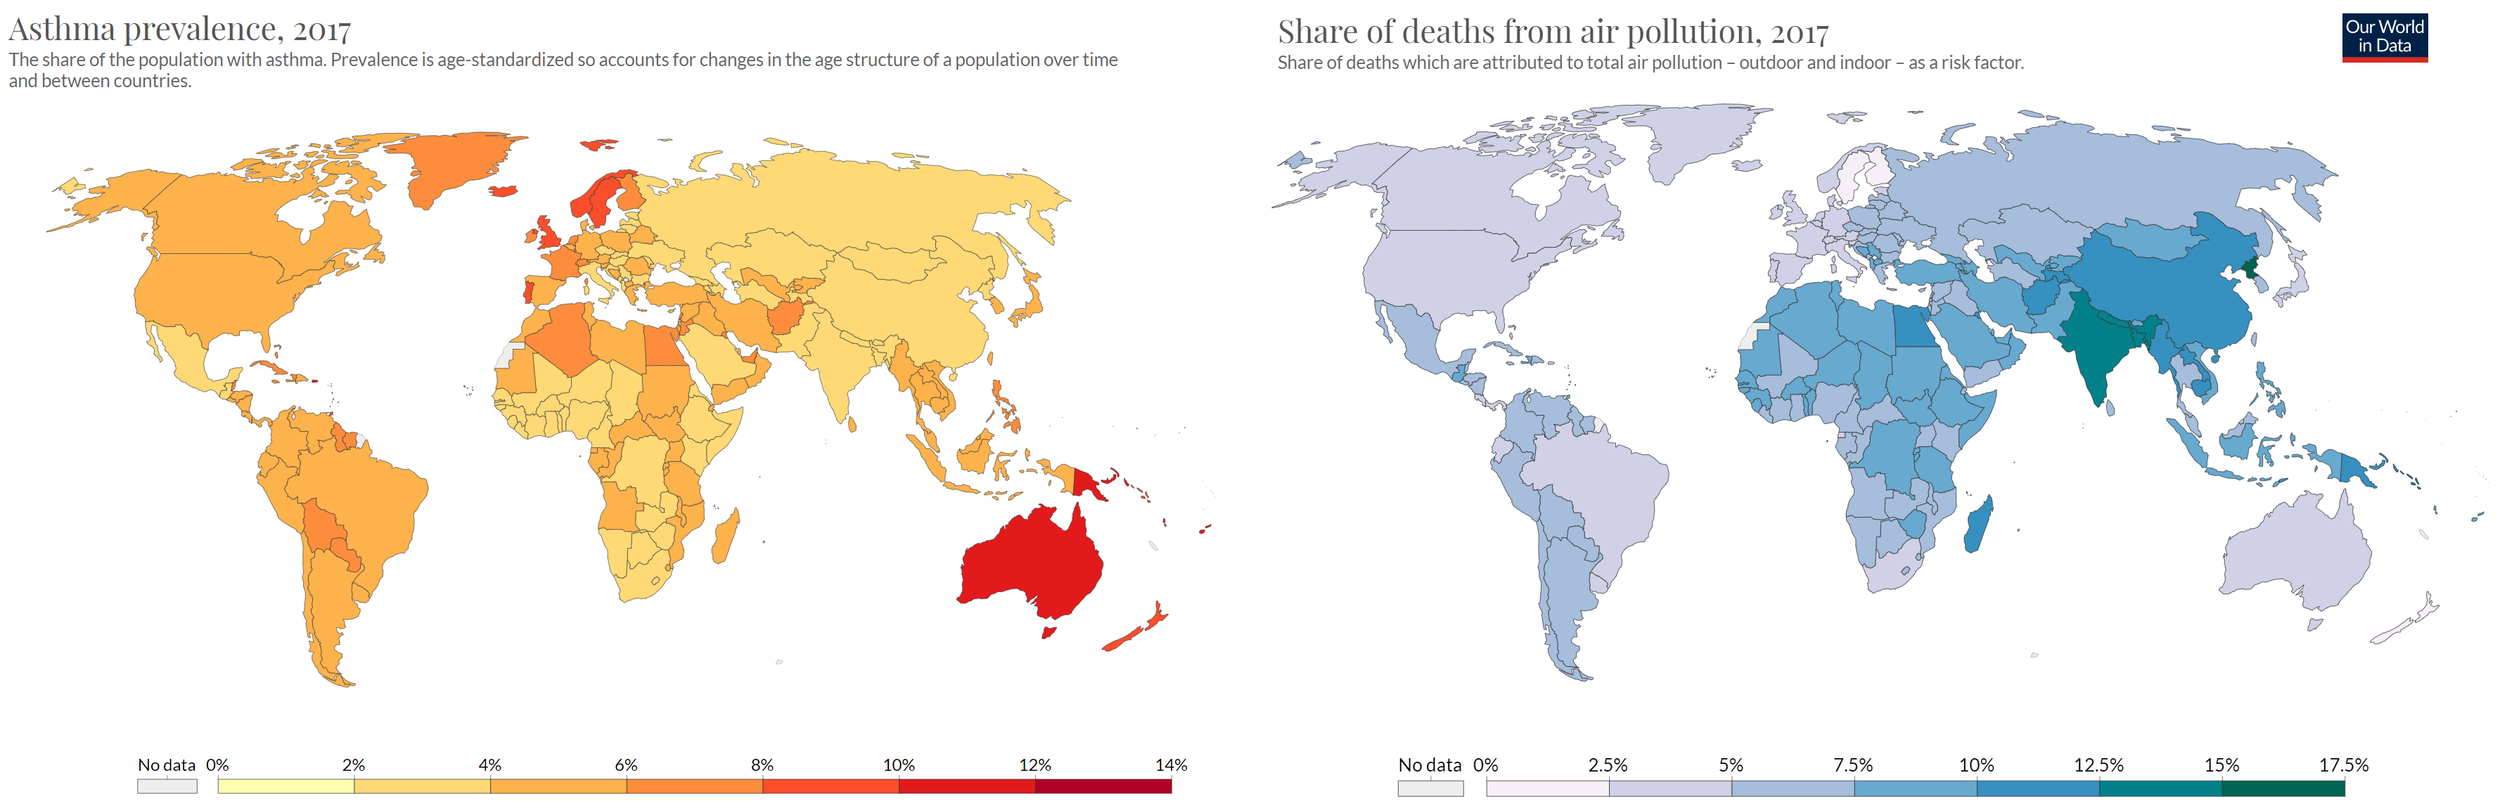
The indoor environment is an artificial place for humans, and pollutants build up to levels that harm us and our children. 1 in 11 UK children have asthma, and the rates of people dying from asthma attacks in England and Wales has increased by more than 33% in ten years. The UK has one of the worst asthma death rates in Europe. 40% of children in the UK have been diagnosed with an allergy. Countries with the highest death rates from ambient air pollution don’t seem to correlate with high asthma rates. But why is this?
The reasons are not clear, but we know both allergies and asthma could be caused by many different factors such as air pollution, the increase in pollen concentrations, the overuse of antibiotics and paracetamol with children, obesity, and energy-proofing of indoor environments. In the UK, the number of people with allergies grows by 5% every year, and half of these are children. Why the UK should be suffering higher rates of allergies and asthma is unknown, but we do know that air-pollution-induced-asthma was the official cause of death of Ella Kissi-Debrah in 2013.
An EU project entitled “Respiratory Allergy and Inflammation Due to Ambient Particles” (RAIAP) was set up to determine what was in the air of four European cities (Rome, Oslo, Lodz, and Amsterdam), how this changed over the year, and what health effects were. It was found that some PM2.5, the type from traffic, incinerators and coal/wood smoke, were linked with respiratory allergies, and others like sea salt, resuspended road dust, desert dust, soil, and sand were linked with systemic allergies (like anaphylaxis) and asthma.
‘Thunderstorm asthma’ is the triggering of an asthma attack by environmental conditions caused by a local thunderstorm and, with extreme weather becoming more regular, we will likely see greater incidents of thunderstorm asthma. Grass pollen are swept up into thunderclouds and then as they break up from ‘osmotic shock’ from rainwater, they are small enough to become inhalable and cause respiratory reactions. Asthmatic reactions, often severe, occur within the first 20-30 minutes of a thunderstorm during the gusts, and grass pollens may be the reason.
Hayfever is on the rise. For city-dwellers, this may be due to overplanting of male trees. Male trees release pollen and female trees absorb it. In a natural woodland, you would get an even split between tree sexes but, to avoid the fruits of female trees staining pavements, cities are dominated by male trees. This pollen enters houses and settles on beds, increasing our exposure. Climate change leads to trees releasing their pollen at the same time as grasses, which further increases the pollen count. CO2 encourages flowering and with that more pollen. Traffic fumes react with pollens, causing them to be more allergenic. The proteins in pollens are similar in shape to many foods, such as birch pollen proteins with apples, almond and kiwis; grass with melons and tomatoes; and ragweed with bananas and cucumbers.
Another thing about trees and air pollution: the leaves have a wax on them to regulate their water, and air pollution is highly associated with ‘dewaxing’, leading to leaf loss and lower resilience to droughts. With droughts becoming more common, air pollution further increases the chance of forest death and wildfires.

Which pollens might lead to food allergies. From here.
Allergies are, like many things, likely to be due to humans causing an imbalance in nature. A good idea would be to think very carefully about tree distributions and diversities and to spend less time indoors or improve ventilation.
Ozone
If I were to talk about our problem with ozone, you may think that this has already been solved, but today ozone kills around 140,000 people per year by chronic obstructive pulmonary disease (COPD).
But there is a difference between good ozone in the stratosphere, shielding us from UV radiation, and ground-level ozone that creates smog and damages food crops. Ozone is created from NOx and VOCs emitted by traffic, ships, oil refining, and power plants and can kill crops, trees, insects and other animals. Between 20-30% of India’s pea and mung bean yield are lost from ozone. It can give you streaming eyes and a rasping throat. It reduces the rate that trees can absorb CO2, a vital tool we are planning to use to fight climate change. Paradoxically, planting too many oaks, willows or poplars in one place can also create dangerous levels of ozone, so we have to be careful to balance species in tree-planting schemes. Fossil fuel derived solvents in cleaning products, hairsprays, spray deodorants and glues react with ozone to form smog, and half of LA smog comes from this type of consumer product, more than traffic or industry.

How ozone is formed from car exhausts and solvents. The chemistry is really not this simple, but it makes a good graphic! From here.
Ozone spikes in heatwaves and a significant proportion of heatwave deaths are attributed to ozone exposure. Ozone also spikes from forest fires. Methane from landfill, cattle and oil refineries forms ozone. Ozone can be created over a thousand miles away from the source, and is therefore a global issue in the same way as climate change. When the protective ozone layer suddenly thinned and a gaping hole was left over the south pole, governments worked together to address the emergency. This was easy – just a few companies had to be regulated, some changes were made to technology, and our lifestyles were unaffected. Ground-level ozone from petrochemicals, though, is much harder to reduce as it means changing our lifestyles and extends even to how we manage land. The advantages of urbanisation and industrialisation will be counteracted by rising death rates and food shortages if methane and NOx emissions aren’t reduced.
Out of all air pollutants, climate change will have the greatest impact on ozone concentrations. Increases in temperature will lead to increases of ozone formation. Hot summers, like that of 2003 when there was a substantial photochemical smog episode in Europe, including the south-east of England, are likely to become ‘typical’ by the 2040s, leading to a higher frequency of summer pollution episodes.
extreme weather
Heat waves, droughts, wildfires, cold waves, snowfall, and flooding are all predicted to be more common and more severe, and they can all affect air and water quality.
Heat waves occur when air is stagnant, trapping the warm air and pollutants. In a city, the two classes of gases - NOx and VOCs - are produced and these react with heat and sunlight to form ozone. NOx comes naturally from soils, but with increased contributions from transport (road, airports and diesel rail), power stations, other industry and combustion processes, the concentrations increase. VOCs are also naturally produced by vegetation, but also from transport, combustion processes, solvents and oil production. The natural sources of NOx and VOCs created the ozone in the troposphere, but with increased concentrations of NOx and VOCs at ground level, ozone can flood ground-level too.
Here is something that might frustrate you: taking away cars wont reduce the ozone levels. During the 2020 March-May lockdown in the UK, NO2 from vehicle exhausts fell by 42%, yet ground-level ozone rose by 11%, with higher concentrations in the southern cities. This is the wrong way around, surely!? The proposed reasons for this are complicated, but one of the reasons is increased UV radiation and temperature in 2020 compared to previous years. This means warmer weather can worsen air quality.
Heat waves and droughts can dry out crops and vegetation, making them more prone to wildfires that produce hazardous smoke. In Alaska, June air temperatures alone explained approximately 38% of the increase in the area burned annually from 1950 to 2003, which is expected to rise with a warming climate. The smoke generated by the 2019-20 bushfires in Australia were found to have killed 12 times more people than the fires themselves. There is also evidence to say that wildfire smoke is up to 10 times more deadly than an equal dose of city air pollution. The annual mean PM2.5 in Northern California has increased since 2015 due to massive seasonal fire events, and wildfires have become the dominant source of PM2.5 (on fire days, the 10-min average outdoor PM2.5 exceeded 250 μg/m3, but indoor air was generally 20% of this).
‘Cold waves’ or ‘cold snaps’ are when cold air is trapped on the land surface, which can also trap air pollutants like heat waves can. The difference is the source of pollutants in cold weather are from burning wood or other fuels, and when combustion cars are least efficient. Space heaters produce the silent killer carbon monoxide, which is also trapped in cold waves.
Flood water can make the air in a home unhealthy. This is because when things remain wet for more than two days, they usually get mouldy. Inhaling mould can cause adverse health effects, including allergic reactions. Poor air quality can also trigger flooding, as aerosols can block sunlight and radiation from reaching the Earth, which increases the freezing point at raincloud altitude and this leads to rain instead of snow. In Nepal, for example, air pollution could lead to accelerating the rate of glacier melt due to reduced snowfall and increased rainfall. This demonstrates that the effects of air pollution should be discussed beyond its immediate impact on human health.
Smoking
Many people in XR have changed their lifestyles for the environment and for social justice. We have changed our diets, reduced our waste, most have stopped flying altogether, and yet there remains a large blind spot that many of us still support, a practice that funds environmental destruction of the poorest countries and their communities. A contradiction that we need to change. This is smoking tobacco.
Every year, 9,500 children in Britain are admitted to hospital because of secondhand smoke, and it accounts for 1 in 5 cot deaths in the UK every year.
Growing tobacco often includes child labour and substantial chemical usage, affecting the drinking water of local communities, where 9 of the 10 largest tobacco cultivators are low-income or middle-income countries where tobacco growing and processing causes environmentally destructive agricultural practices. Curing tobacco needs wood and charcoal, which are major contributors to deforestation. In Malawi, for example, tobacco production accounts for the largest share of agricultural land, and it is estimated to have caused up to 70% of national deforestation there.

A girl in Indonesia handling tobacco leaves, an emormous problem in the already toxic industry. From here.
The growers suffer poisoning from pesticides and absorbing tobacco through the leaves. In a 2010 study of Pakistani tobacco farmers, only 14% used masks and 9% wore gloves, and the majority had pesticide poisoning. Another study found that children who work as tobacco pickers absorb around 50 cigarettes’ worth of nicotine through handling the leaves, leading to green tobacco sickness. We campaign for social justice, but we never challenge this.
The highly damaging high-phosphate fertilisers used to grow tobacco contains polonium – the radioactive element that was used to kill Litvinenko. Polonium causes illness in the farm workers, including those children, and accumulates in the lungs of smokers leading to lung cancer. The major tobacco manufacturers discovered that polonium was part of tobacco and tobacco smoke more than 40 years ago and attempted, but failed, to remove this radioactive substance from their products. Internal tobacco industry documents show that the companies suppressed publication of their own internal research – just like Shell and the greenhouse effect – to avoid heightening the public’s awareness of radioactivity in cigarettes. Tobacco companies continue to minimise their knowledge about polonium. Cigarette packs should carry a radiation-exposure warning label, but it’s not just the smokers themselves who suffer this radiation, it’s also the people around them and the children who pick and process the leaves.
Remember, every time a smoker buys tobacco, they are directly funding this industry and allowing it to continue its ecocidal and child-harming practices. Tobacco and fossil fuel companies are cut from the same cloth, and we should not fall for the trick that smoking is an expression of our freedom, when in fact it is an expression of our ignorance and gullibility.
underground trains
In general, all underground trains have the worst air quality in a city. This is because air is trapped in tunnels, where particulate matter is constantly disturbed and created by trains. The deeper the platform, the more difficult it is to exchange the air, and the worse the air quality is. Much of the particulate matter from the trains is metallic, so researchers have consistently found that pollution particles underground are heavier than those outside. A lot of the dust comes from passengers too. Before the 1987 fire in King’s Cross tube station that killed 31 people, piles of fluff, hair, newspapers and rubbish frequently caught alight from discarded matches and cigarettes, under wooden escalators, and from sparks on the tracks.
A 2019 study on the London Underground showed the worst affected line was also the deepest: Victoria with median PM2.5 concentrations of 361 μg/m3 and a peak of 885 μg/m3, compared to the roadside level median of 14 μg/m3. To give some more context, the UK government’s COMEAP (2009) suggested a 6% increase in death rates per 10 µg/m3 increase in PM2.5 concentration (as an annual mean). This figure, though, ignores both impacts of size below 2.5 microns and composition, and there is currently no clear understanding how these factors affect particle toxicity.

The Central Line of the London Underground, showing the deepest stations have the highest levels of PM2.5. From here.

Various lines from the London Underground showing a general trend between depth and PM2.5 concentrations.
Before the pandemic, the London Underground handled 2.8 million passenger journeys each day with an average journey time of 47 minutes. Despite the average PM2.5 exposure in London already being 30% over the WHO guideline, taking a 47-minute return journey between Notting Hill and Bethnal Green on the Central Line would put you 120% over this guideline.
I live in London and I don’t take the tube because the air is too polluted. You can check the pollution levels at different stations here.
Silvertown Tunnel and airport expansions
We know that building new roads increases traffic and road construction degrades air quality. The Silvertown Tunnel, a toll-road under the Thames, aims to reduce congestion going through the neighbouring Blackwall Tunnel. This project started construction is estimated to cost £2 billion by 2050, money that could be better spent on improving active or public transport rather than providing more options for drivers of private vehicles. The pollution generated affecting local residents was not fully considered, with the Mayor of London Sadiq Khan planning to monitor only NO2, and merely ‘considering options’ for monitoring other pollutants generated by the tunnel traffic. Luisa Porritt stated “A new road in the city will cause more air pollution and make meeting our climate change targets much harder. The only responsible thing to do is to abandon the project and invest in greener forms of transport instead”.
When it comes to airports, governments claim that Gatwick and Heathrow expansions are at ‘low risk’ of breaking the limits, but a 2003 study showed LAX airport increased the particle number in the city by more than ten times. 8 km downwind concentrations from LAX airport exceeded 75 000 particles/cm3. A site in Marylebone in central London saw an increase in particles from Heathrow, 22km away, when the wind blew from the west. This is because aeroplane fuel has much less stringent limits on the amount of sulphur, at 300 times greater than road fuel. This is mostly to save money. This sulphur creates huge numbers of tiny particles that can extend to a range over 40km from a major airport.
A big issue around measuring air pollution around airports is that most of the particles are too small for low-cost instruments to measure. These ultrafine particles (PM0.1) are invisible unless specialist equipment is used, and there are only 4 monitoring stations in the UK that routinely measure PM0.1, with none around any major airports. This is a concern, because PM0.1 may affect humans in different ways to PM2.5 and could be more toxic because their higher surface area enables them to carry more toxic material like heavy metals. Although road vehicles are the primary source of PM0.1 in urban pollution hotspots, around airports PM0.1 is found in higher concentrations under landing jet pathways (most aircraft approach Heathrow over Greater London), and particles smaller than 40 nm were found to make up 85–90% of the number of particles measured in the airport tarmacked areas. Passenger planes burn through around 4 litres of fuel per second, and this rises to 5.5 litres/sec during takeoff.
Jet engine particles and commercial airport particles both contain toxic heavy metal particles including lead, cobalt, nickel, arsenic, cadmium and mercury. Adding together the airmiles of all airline passengers in 2018 totals 8269 billion km, which is equivalent to taking 1000 return trips to Pluto… in one year. This continued to rise at 5% every year between 2013-2018 and, although there was an 90% decline from Feb to Apr 2020, they are quickly returning to pre-pandemic levels and flying is continuously encouraged by the media and the UK government. Regarding the carbon emissions created by flying, a return flight to Australia from the UK produces around 4000 kg of CO2, which wipes out 20 years of recycling (saving 200 kg CO2e per year), or 5 years of eating a plant-based diet (saving 800 kg CO2e per year). Around 1% of the world population emits 50% of CO2 from commercial flying, highlighting the wealth inequality of flying, and affirms that current climate policy for aviation is inadequate. If other emissions, such as NOx, soot, and cloud formation are included, the warming effect of aviation could be four times greater than CO2 alone, accounting for 3-7% of global CO2e emissions, and up to two thirds of the UK’s carbon budget for 1.5C by 2050.

The Guardian newspaper front cover in July 2021 raises the alarm on the Amazon tipping point while at the same time promoting flying holidays. The next day, the front cover featured catastrophic floods in Germany and Belgium with a full page advert for British Airways on the back. This is an example of the media’s promotion of polluting activities.
Don’t be conned by offsetting schemes or green leaf icons or the prefix ‘eco’ on any flight comparison websites. Skyscanner has a picture of a leaf to show the ‘least emissions’ based on three factors: aircraft type, distance travelled, and aircraft capacity. If a flight has more than 4% CO2 reductions than a standard flight, it is marked as ‘a greener choice’. There is not even offsetting, it’s just greenwash. ‘Offsetting’ sounds like all of your emissions are absorbed elsewhere, but 85% of offsetting schemes failed to reduce emissions at all, with EasyJet’s trees being cut down before maturity and cook-stove projects likely to considerably over-estimate the emission reductions due to a number of unrealistic assumptions and default values. Ryanair’s offsetting reduces less than 0.01% of their emissions. No offsetting schemes reduce air pollution generated around airports. ‘Sustainable aviation fuel’ is also a con, with issues around crops coming from deforested land or land that would be better used to produce forests or food, rather than plane fuel.
If we want to be serious about scaling down airports, we need to think about reducing our flying habits (1 in 12 international air passengers are from the UK) and our buying habits. People might wonder why there were still international flights during the Covid-19 travel bans, but 25% of aviation fuel use is for transporting perishable goods such as fruit, vegetables, and flowers. The UK spends around £2bn every year on cut flowers that have to be air freighted as they lose 15% of their value for every day they spend travelling. Many come from Kenya and Colombia via the Netherlands. Most of Scottish seafood sent outside the EU is flown out of Heathrow, with Scottish salmon sales of £193m to the USA and £85m to China and Taiwan. Also, items such as fast fashion, mobile phones and computer games are flown, often from China to the USA or Europe, as most of the profits are reaped in the first few weeks of sales. Another bizarre use of planes is for wine. A European ruling from 1954 stipulates that shipments of Beaujolais Nouveau must leave the European Union on the second Thursday in November, leaving one week for bottles to reach destinations all over the world in time for celebrations of Beaujolais Nouveau Day. In 2017, 3000 tonnes of Beaujolais Nouveau (2.5 million bottles) were air freighted to Asia.
If we want to improve infrastructure, we should be concentrating our efforts on developing public transport rather than expanding fossil-fuel dependent air travel, reducing aviation subsidies (at £7bn per year) despite the larger economic returns, educating the UK’s Secretary of State for Transport who wants to ‘speed up the return of flights’, and discouraging polluting and carbon intensive private car ownership and demand for rapid international items.
Private cars
As a nation, the UK has become reliant on private cars due, in part, to lobbying from the car industry, who knew about the risks of climate change since the 1960s. Private car ownership is essential in areas where public transport is poor, expensive, or not even an option, and the extensive road network in the UK and mainland Europe has carved up the landscape has had dire effects on our biodiversity. Although a lot of focus on car travel is on the emissions, it’s estimated that the annual social cost of urban road noise in England is £7-10 billion.
The idea of blocking cars from cities is becoming more attractive from concerns over air pollution and the climate emergency. Brighton has proposed a zone where private car journeys are banned, York is considering banning cars within its medieval walls; Bristol will exclude diesel cars from a central area between 7am and 3pm; Birmingham is developing a plan to stop people driving through the city centre; Manchester proposes a fee-paying clean air zone in the city from 2022; and both Norwich and Cardiff wants to introduce a congestion charge. London’s cycle lanes and low-traffic neighbourhoods have also reduced emissions, but much more needs to be done. Indeed, there is no evidence that London’s cycle superhighways have reduced traffic congestion.
Idling engines produce enough exhaust to fill 150 balloons of toxic chemicals including PM2.5, NOx, ozone and cyanide… every minute. Police and taxis hate being challenged about their idling engines. You can tell them it is an offence in law under the Section 42 (the answer to Life, the Universe and Everything) of the Road Traffic Act 1988. Some boroughs like Hammersmith and Fulham have an experimental traffic order since Nov 2018 to fine motorists who idle and even have an app where you can report it, although reporting it often leads to no enforcement. You could check that your borough has a policy like this.
For people who drive, their biggest exposure to daily air pollution comes while they are driving their car. In a small volume, emissions from whatever is driving ahead (such as PM2.5 and NOx) are brought into the cabin and accumulate. CO2 levels increase from the outdoor level of 415 ppm to over 2500 ppm after ten minutes, which is associated with decreased concentration and impaired performance. A study compared PM2.5 exposure when people took different modes of transport from Camden to Holborn (an hour walk) and found the highest exposure was inside a car because exhaust from the vehicles in front get sucked into the car, and it often stays trapped there, meaning you might breathe in more of the pollution. You might think that opening the windows would allow this pollution to escape, but a follow-up study showed, paradoxically, that driving with windows closed significantly reduced drivers’ exposure to PM2.5, but increased the CO2 levels. A balance between opening the windows and closing them is a difficult one, and another reason to walk, cycle or take the train (when there’s not a deadly virus around). As air pollution disperses outside, a high exposure to pollution from a dirty exhaust will be short-lived and taking routes away from main roads (in London, at least) can reduce exposure to air pollution by an additional 30%. Professional drivers cannot do this, and are exposed to 2.6 times more air pollution, with taxi drivers experiencing the highest exposures due to the time they spend working in congested central London. The solution here is to reduce the number of professional drivers and to equip those remaining drivers with systems that balance CO2 and build-up of in-cabin pollutants.

CO2 levels in both the front and back of a car quickly rise to over 2500 ppm within 10 minutes, from here.
Now onto electric cars. Despite the Which? Investigates episode ‘how green is an electric car’ saying “the driving of an electric car does indeed have zero emissions, and that is great because then it’s not contributing to deadly air pollution”, electric cars, like all cars, emit up to 1000 times more particle mass from tyres than modern exhausts. In London alone, there are 2.6 million registered vehicles emitting approximately 9 million kg of tyre wear particles per year, releasing a range of toxins into the environment. Electric cars are heavier than petrol or diesel cars, so the rate of tyre wear increases. Tyres are said to account for 28-34% of all microplastics released to UK surface waters, and account for 5-10% of ocean microplastics globally (although this figure is very difficult to calculate and therefore has high uncertainty).

Estimated final sites for tyre wear particles in the environment from here. Models estimate 45% of the total tyre particle mass accumulates near the road, whilst the remaining 55% ends up in the environment through various mechanisms. Of these particles that enter the environment, 82% are carried by water and the remaining 18% of the particles are expelled into the air, from here.
It is estimated that 3 billion end-of-life tyres are generated each year, and 4 billion are currently in landfill, causing a risk for air pollution due to combustion. Tyres use 70% of all natural rubber grown, which is a major cause of deforestation. Once a tyre has lost its tread and needs replacing, most are either burnt in cement kilns (Europe: 45%) or recycled (Europe: 46%) into tyre crumb rubber for children’s playgrounds, football turfs and road surfaces, but high concentrations of heavy metals (mainly zinc) and hazardous organic chemicals have been detected in the run-off. Most of the remaining of tyres go to energy production (they are burnt). A burnt tyre produces around the same CO2 emissions per kg as coal. A King’s College London study suggested that brake dust may be just as bad for the lungs as diesel exhausts. There is currently no legislation on these emissions, and they are expected to rise from 7.4% today to 10% of all UK PM2.5 emissions by 2030. There are efforts to reduce tyre pollution, and regenerative brakes reduce the brake wear emissions. Tailpipe emissions are eliminated with electric cars, but the emissions from tyres and brakes still remain. Electric cars also create a strong wind that resuspends settled dust from tyres, brakes, exhausts, and the road itself, which counts for the highest proportion of non-exhaust road traffic emissions (28-59% of PM10 mass). Our dependence on private cars is unavoidably polluting, destructive and unsustainable, and we require stronger efforts towards travelling less, using bicycles and campaigning for public transport improvement, and finding alternative ways to get our food.

A PM2.5 brake dust particle in lung cells

The pathway of tyre and brake emissions from traffic into the oceans. From here.
With around 1.3 cars per person outside London and over 70% of UK journeys between 1-5 miles being taken by private cars in 2019, the dependence on roads, parking spaces, fossil fuels, etc is enormous. Air pollution from manufacture, emissions and car-supporting infrastructure are significant and encouraging active transport such as walking and bicycle travel is necessary.

Many more people take cars than bicycles for journeys under 2 miles. From here.
The effect of Covid-19 on UK transport. Cars quickly return to their baseline level, whereas public transport remains at around 50%. From the July 2021 report Decarbonising transport: a better, greener Britain.
the diesel car scandal
Europe has many more diesel cars than the USA does, and this is largely due to tax and regulation. When ‘heating oil’ was phased out in Europe in favour of natural gas, fossil fuel companies marketed diesel in Europe as a low-carbon mode of transport, and therefore better than petrol for controlling climate change. This led the way for tax breaks for diesel in every European country (duties are about 30% lower for diesel in Germany) and encouraged European car manufacturers to produce small diesel engines. At 2017 rates, the average European diesel car owner spent 2000 euros less over the car’s lifetime than a petrol car owner. It is more difficult to control the particulate pollution and NOx produced from a diesel engine, and the USA have stricter regulation and higher tax to reduce these harmful emissions. During the diesel boom between 2000-2005, European standards on exhaust allowed diesel cars to emit three times more particle pollution and NOx than petrol cars, whereas the USA standards were the same for both.
It is true that diesel provides more miles per gallon, but it is not well known that the reason for this is because a gallon of diesel contains a lot more energy and releases a lot more carbon dioxide than a gallon of petrol. Diesel cars emit 13% more CO2 per km than petrol cars.
Diesel also produces ‘black carbon’ - sooty black carbon particles - whereas petrol engines emit almost none. It is black carbon that dominates the soot deposited on Arctic snow, which absorbs sunlight and encourages melting. Diesel engines emit over 100 times more ultrafine particles (PM0.1) than petrol engines, which are more dangerous than PM2.5 due to their ability to pervade the body more easily and carry more toxic substances with their higher surface area.
The marketing of diesel cars was so successful that demand for diesel exceeded what Europe’s refineries could produce. Russia supplied the excess from old and inefficient refineries that produced a lot more carbon dioxide to make each litre of diesel.

VW diesel advert from 2016
In 2005, when NOx was more heavily regulated, levels were seen to increase across Europe every year from 2005-2010, at an average of 5% per year in both London and Paris. By 2015, European cities were nowhere close to their NOx targets, with London streets at three times over the limits. In the UK, it was estimated that around 17,500 early deaths per year were caused by NOx. It was getting out of control, but the source was unclear.
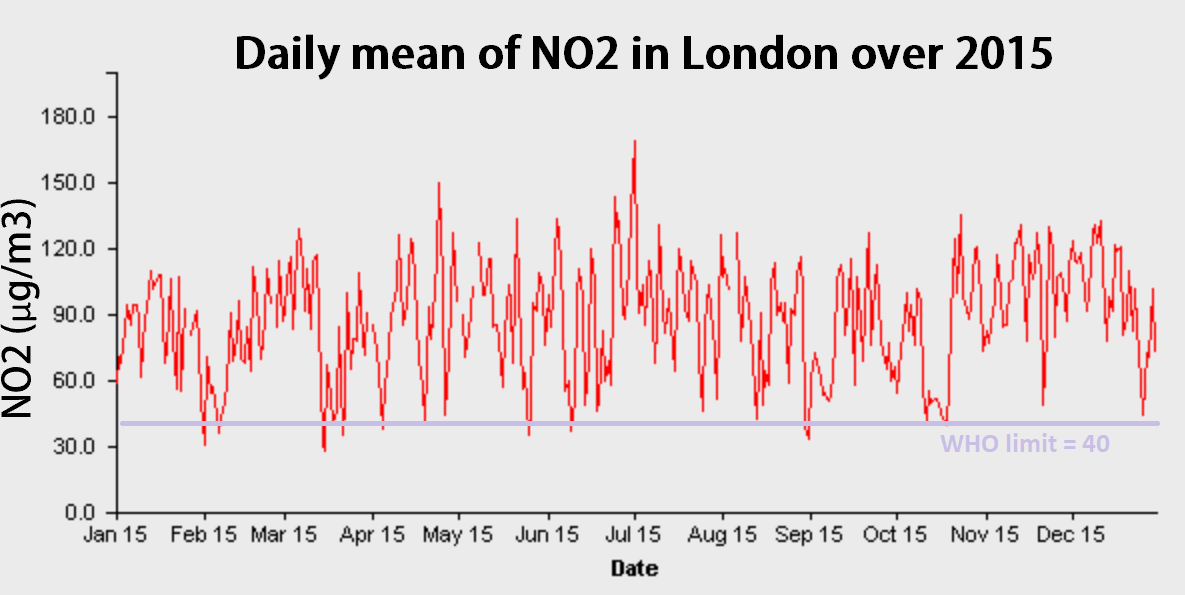
NO2 readings Marylebone Road in London over 2015. The annual limit was 40 µg/m3. You can find historical data from various London sites on other air pollutants here.
In a 2013 study, emissions from passing traffic in London were measured and the newest diesel cars produced the most NOx, despite them passing even tighter tests before sale. This is because diesel cars were designed with software to recognise when they were being tested, and then change their engine and exhaust controls to produce lower emissions. Their real-world emissions were around 7 times higher than in tests, making them emit more NOx than a full-laden lorry.
Once this scandal was exposed by the International Council for Clean Transport (ICCT), VW admitted to cheating exhaust emissions tests and the chief executive resigned and faced prosecution. However, more companies than just VW were guilty of this practice, such as Renault, Volvo, Nissan, Hyundai, and Citroen. This largest deviation between lab tests and real-world NOx emissions were from Jeep Grand Cherokee, which emitted 9.6 times over the limit during tests conducted by Which? In 2017; which incidentally also produces the most CO2, at 1 kg for every 2 miles.
Cheats were also found in UK diesel lorries in 2017, with 1 in 13 found to be fitted with device or modifications in their exhaust system to reduce operating costs but increases the NOx emitted.
Throughout the diesel scandal, governments have continued to trust the assurances of industry when all the evidence told a different story. We are in a society where the voice of the polluter drowns out the voice of the environmental and health scientists. VW still somehow retains its social license and was an official sponsor for the Euros in 2021. With continued rhetoric such as ‘we can’t change overnight’, we must continue to challenge how long they have already had and chosen not to act, while purposefully providing cars that spewed out unacceptable levels of pollution when driven past homes and schools.
microplastics
Microplastics are everywhere and may be having a profound impact on people’s hormones, affecting blood pressure, fertility, immune systems and causing multiple diseases including cancer. Plastic softeners called phthalates are found to reduce fertility in men and women. This review of 185 studies shows that fertility among men in North America, Europe, Australia and New Zealand declined by 50-60% in the past 50 years. They are absorbed by humans by inhalation, drinking, and eating. Petrochemical microplastics are estimated to represent 33% of the fibres in indoor environments, with up to 11,000 fibres settling on every square metre indoors. With hand-to-mouth ingestion in young children, this level of exposure is concerning. The number of microplastics floating in indoor air can be 40 times higher than outdoor air because of clothes, carpets, curtains etc that contain synthetic fibres. Based on consumer guidelines, the average person ingests over 5,800 particles of synthetic debris from tap water, beer and sea salt annually, with the largest contribution coming from tap water (88%). Despite tea bag companies claiming that ‘plant-based materials’ are the way forward, even the plant-based plastics pose a threat, and can release up to 11.6 billion microplastics when brewed, and these can cross the barrier of the gut into the bloodstream. The effects of ingesting microplastics into the human body are unknown, but significant behavioural effects are observed in fish larvae and water flea mortality with exposure to microplastics. This is important, because when the air and oceans are full of microplastics, and the smallest organisms are either killed or adversely affected, the human food supply and ecosystems that humans rely on may be severely affected. When the foundation of the food web is affected, the whole system feels it. This is not all about humans, but these arguments unfortunately seem to hold the most weight.

Microplastics ingested by a water flea that’s 3mm long glow green. In a lab, fleas were exposed to round beads and irregularly shaped fragments in amounts higher than in nature. The irregular pieces pose a greater threat because they can clump and get stuck in the gut. From the National Geographic.
It is estimated that 10% of microplastics eaten or drunk are absorbed by the body and between 14,000–68,000 microplastics are estimated to be breathed in or consumed every year in a typical UK household. Microplastics smaller than 10 microns can penetrate into organs, cross cell membranes, the blood-brain barriers, and the placenta. Although industry workers who are exposed to extremely high concentrations of airborne microplastics suffer respiratory illnesses, there is still a huge lack of knowledge regarding the accumulation and toxicological effects of plastics in the lungs and digestive systems. Microplastics may carry other toxic materials into the body, such as heavy metals or cancer-forming polyaromatic hydrocarbons (PAHs), and could contain harmful chemicals themselves.
Following current trends, global plastic production is projected to reach an accumulative 25 billion metric tonnes by 2050. As larger plastics break down through light and abrasion, they become ‘secondary microplastics’ (particles ≤5 mm in size, although there are efforts to redefine them as ≤1 mm in size). ‘Primary microplastics’ are manufactured at this size, such as microbeads. Between 93,000-236,000 metric tons float on the global sea surface. A key indicator of microplastics in the ocean is commercially bought sea salt, where 90% of these salts contain microplastics. A 1998 study, only one of few that study health effects of microplastics in the lungs, found inhaled fibres were present in cancerous lung specimens and concluded: “These bioresistant and biopersistent plastic fibres are candidate agents contributing to the risk of lung cancer”. 92% of airborne microplastics in London are fibrous, suggesting that they come from clothes and other textiles. In the indoor environment, there are many goods, materials, and interior furnishings that can give off plastic fragments due to wear and tear, and it has been argued that these sources are substantially more important for human exposure than microplastics contained in food and drink.

Microplastics from inside sea salt grains, from here.
Scientists have found microplastics everywhere they look, from Arctic snow and mountain soils, to many rivers and the deepest oceans. Plastic that settles on flowers makes its way into honey, as do pesticides, antibiotics and heavy metals through similar pathways. Other work indicates particles can be blown across the world. Very little measurement of ‘microplastic rain’ has been done, but a study has shown the remote, pristine mountain catchment in the French Pyrenees has a daily rate (365 microplastics per m2) comparable to Dongguan, China (175-313 microplastics per m2). A study shows London’s rate is around three times higher (575-1008 microplastics per m2). The researchers do not know the reason for the variation, but differences in experimental methods are likely to be partly responsible.
In the environment, microplastics can have detrimental effects on aquatic organisms when ingested as shown by Sussarellu et al., 2016 and Wright et al., 2013. Rather than address our throw-away culture, the attempt to make ‘environmentally friendly’ plastics that are ‘compostable’ or ‘biodegradable’ and made from plants is very misleading. A recent study found that biodegradable carrier bags could still hold shopping after having been buried in soil or left in the sea for three years. They require processing in very specific conditions, and neither recycling bins nor general waste bins provide a route. This ‘plant plastic’ is polylactic acid (PLA) and, although it is produced from biological oils, it behaves similarly to petrochemical plastics and still contributes to the microplastic problem. Council waste collections vary across the UK but few if any accept PLA in anything other than general waste. Most people will be left with only one option: the bin. But if it ends up in the ocean, PLA is bad news. “PLA is basically nondegradable in sea water,” says Dr Frederik Wurm of the Max Planck Institute for Polymer Research in Mainz, Germany, which means if it goes into the sea, “it’s not better than any other plastic”.
With a growing production of plastics every year, microplastics are so abundant across the entire globe that they will be a visible layer in the geological record as a key indicator of the Anthropocene. Little is known of the dynamics of atmospheric microplastic dispersion, or their effects on global ecology, so rather than relying on plastics made from plants we should be moving away from plastics altogether.
incineration and exported plastic waste
It is estimated that over 2 billion tonnes of waste is produced globally each year and around half is burned, making this a commonly overlooked major global source of emissions.
Once exported plastic waste is included, the UK has the second-highest per capita rate of plastic consumption in the world after the USA. Until the mid-1990s, the UK sent 90% of waste to landfill, but the methane and toxic chemicals released were catastrophic for the environment. Rather than looking for ways to meaningfully reduce waste, the UK either exported waste to low- and middle-income countries (where it has been found dumped and burned near beaches and rivers) or incinerated it.
Incinerators are named ‘ecoparks’ in an effort to make them seem environmentally friendly, although this is a marketing scam. Although incineration provides 2% of the UK’s electricity, this method produces 30% more CO2 than burning gas and will be the dirtiest form of electricity generation in the UK once coal is phased out. The Edmonton incinerator produces 1.2 kg of PM per hour, which is equivalent to the emissions from over 7,000 diesel car exhausts, and 19.5 kg of NOx per hour, equivalent to 100 heavy-duty diesel trucks. Incinerators are three times more likely to be built in poorer areas.
On average, around 11% of waste that UK citizens place into recycling bins is incinerated, but this varies hugely throughout the country with some councils like Southend-on-Sea (45%) sending much more recycling to incinerators. A part of the reason for this is because incinerators require a certain rate of waste to be fed into them to function. Anecdotally, when I worked for Veolia emptying public bins, I was told to throw both recycling waste and general waste into the same waste collections.
Incinerators are a solution for a society with too much waste and not enough recycling capability, and with the UK’s 48 current incinerators and 18 more on the way, we are in danger of locking ourselves into a system that doesn’t work for the environment or for public health.

fireworks and bonfires
If the fact that 45% of dogs in the UK show signs of fear when they hear fireworks is not quite enough to put you off the idea, the metal-rich air pollution that fireworks create is significant and exposure to firework emissions has been shown to be fatal in asthmatic children.
Independence Day in the USA saw the national daily PM2.5 average increase by 42% and sites adjacent to fireworks displays increase by 370%. During the night of the 2007–2008 Diwali Festival in India, the 12-hr PM2.5 reached a horrendous 591 μg/m3, which was an increase of 390% of the normal level. The Montreal International Fireworks Competition in 2007, PM2.5 remained above 1000 μg/m3 for almost 45 min within a 2-km-diameter area around the display site. For reference, the WHO’s 24-hour exposure limit of PM2.5 is 25 μg/m3.
In a study on Chinese air quality that averaged 1600 monitoring stations over the whole of mainland China, clear peaks of PM2.5 are visible over the Chinese New Year celebrations, where many fireworks are lit (5505 tonnes of firework residues were cleared from the streets of Beijing in 2013).

The average PM2.5 across all of mainland China, showing the peaks from fireworks celebrations. Note that the WHO annual mean PM2.5 guideline is 10 ug/m3. From here.
When asked about the PM2.5 produced by the London fireworks display for the 2017 New Year’s Eve, the Mayor of London Sadiq Khan responded: “We have not been able to estimate the PM2.5 emissions from the fireworks. However, we anticipate that most of particles emitted would have been water soluble which, given the display takes places next to the Thames and weather conditions were relatively damp, would have reduced their impact on ambient pollution concentrations”.
On bonfires, a DEFRA report from 2012 showed London’s air reach levels up to 400 μg/m3 on Guy Fawkes’ Night. Bonfires are dangerous because people, in general, have no idea about what they can burn. Construction timber (the type with a green tinge) is treated with ‘chromated copper arsenate’ (CCA) to preserve it from microbes and insects. The arsenic is what kills the microbes and insects, and what is released into the air when it is burned. The 2008 economic crisis that crippled Greece resulted in many people burning waste construction wood and, by 2015, the city suburbs saw a 30% increase in particle pollution and increased arsenic in the air. Lead was also found in the air as people burned their lead-painted furniture, which is so toxic that even low doses can lead to lifelong consequences, and childhood exposure adversely affects personality. A 2021 study showed people who had spent childhoods in areas with more lead in the air were less agreeable and more neurotic.
Despite these events being short in duration (although some can last a few days), we must remember that the 5-day smoke event in London in 1952 killed around 12,000 people and events such as bonfires and fireworks have the potential to kill. It must be said that there is a stronger association with wildfires and mortality compared with fireworks, and the 2019/20 wildfires in Australia were made 30% more likely from anthropogenic climate change.